How to read the inference market
A guided tour of Attic Standard’s price indexes, benchmarks and market intelligence, for anyone new to AI inference prices.
- Published
- November 9, 2026
- Covers
- 12 sections, from choosing an index to market measures
- For
- Anyone new to AI inference prices
Before the tour
Four ideas every index builds on.
Every time someone uses an AI model, the request is priced. That is inference, and its cost grows with every user and every task.
Model developers, cloud marketplaces, inference platforms and neoclouds. The same model is often sold by several of them at different prices.
Each kind of model is priced in its own unit.
A request is priced in parts: input for what goes in, output for what comes out, and often cached input, a cheaper rate for text sent again.
The tour
Twelve sections, in the order you meet them, shown on the Multimodal index.
The header
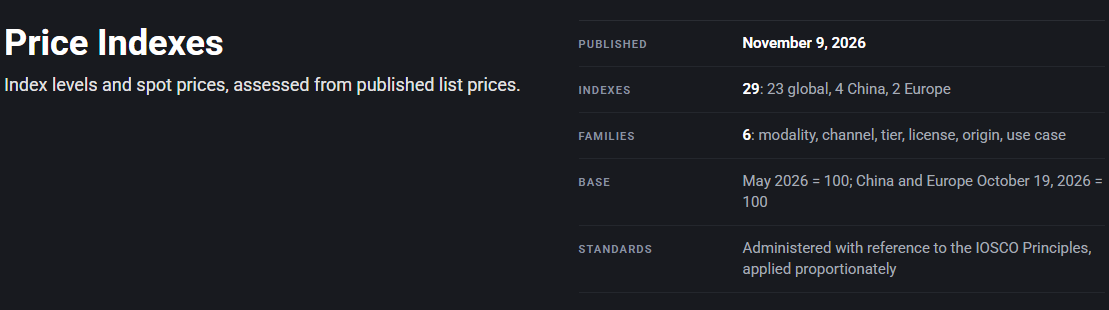
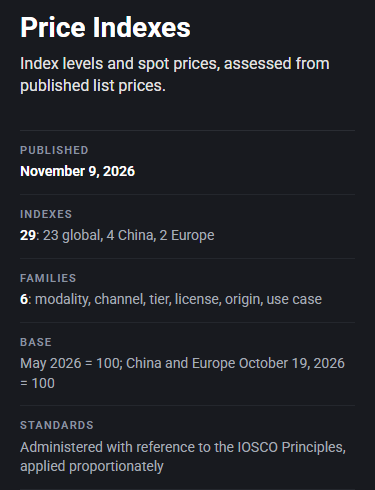
The header gives the publication date, the number of indexes and the base: the period every index level is measured against, set to 100.
Choosing an index
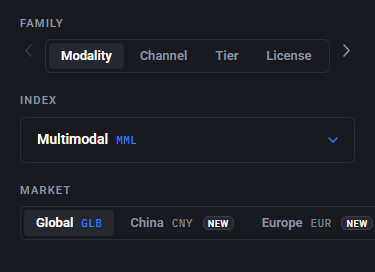
Pick a family, then an index, then a market. Global indexes are priced in dollars; China and Europe in their own currencies.

What the index measures
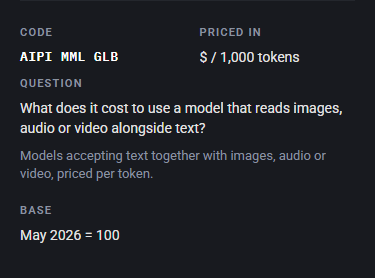
The code names the index: AIPI for AI Price Index, the segment (MML, multimodal) and the market (GLB, global). The question says what it answers; Priced in gives its unit.

The basket
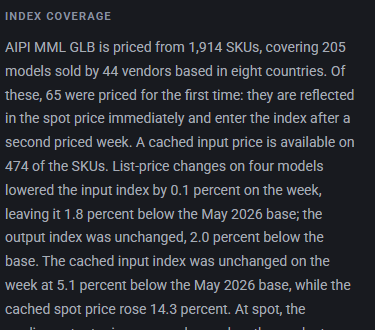
How many vendors, models and SKUs stand behind the index. A SKU is one priced listing. 205 models (192 at base) means 205 are priced now and 192 were priced in May.


Index level: where prices are heading
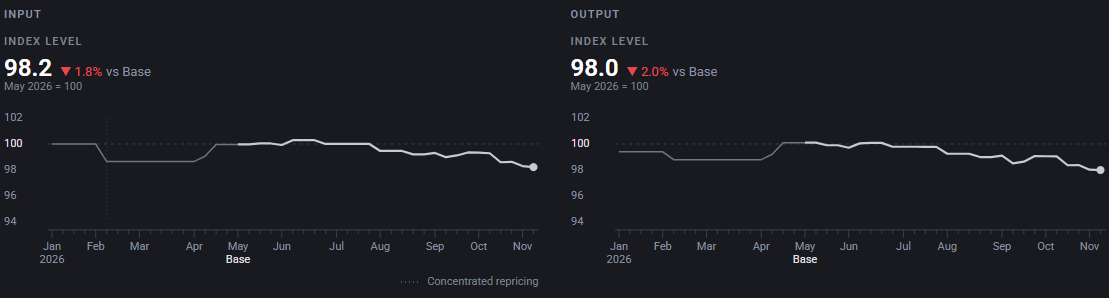
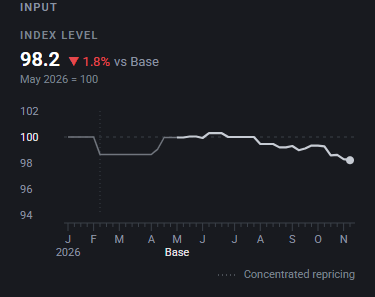
The index level follows the same models and compares each with its own earlier price, so it moves only when a vendor changes a price. 98.2 means prices are 1.8% below May.
Each leg has its own chart. Grey shows the history before the base; a dotted line marks a week when one model drove at least half of the move.
Spot price: where the market stands
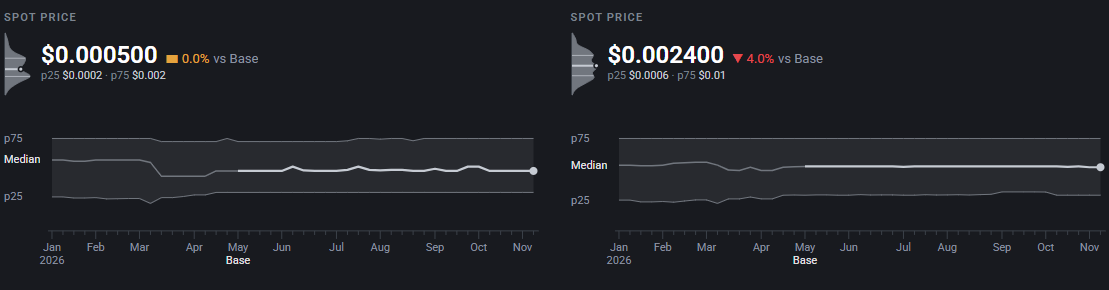
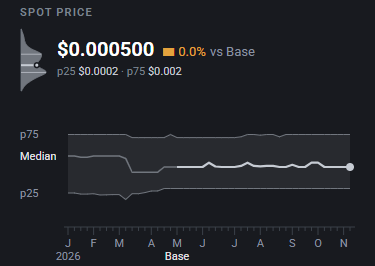
The spot price is the typical price now, in dollars per unit: the median across models, each model counted once however many vendors sell it.
The band is the middle half of the market. Holding a quote? Below the median it is keen, inside the band ordinary, above it high.
The caching cohort
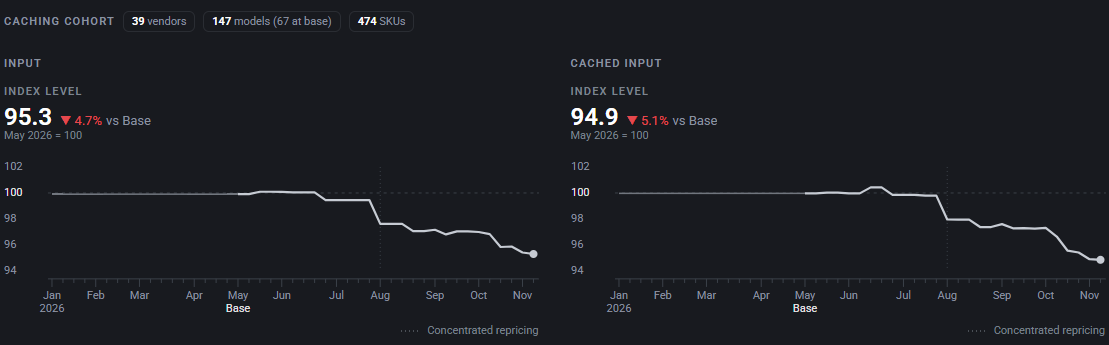
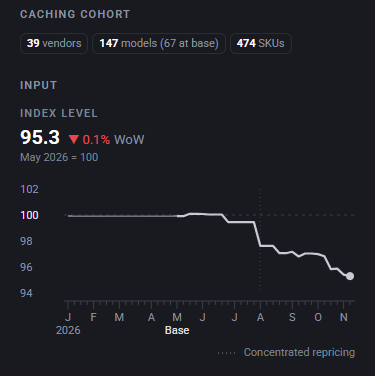
Models sold with a cached rate are shown as their own group, with standard input beside cached input, so both are read on the same models. Here cached input is 5.1% below May, against 4.7% for standard input.
Where it comes from
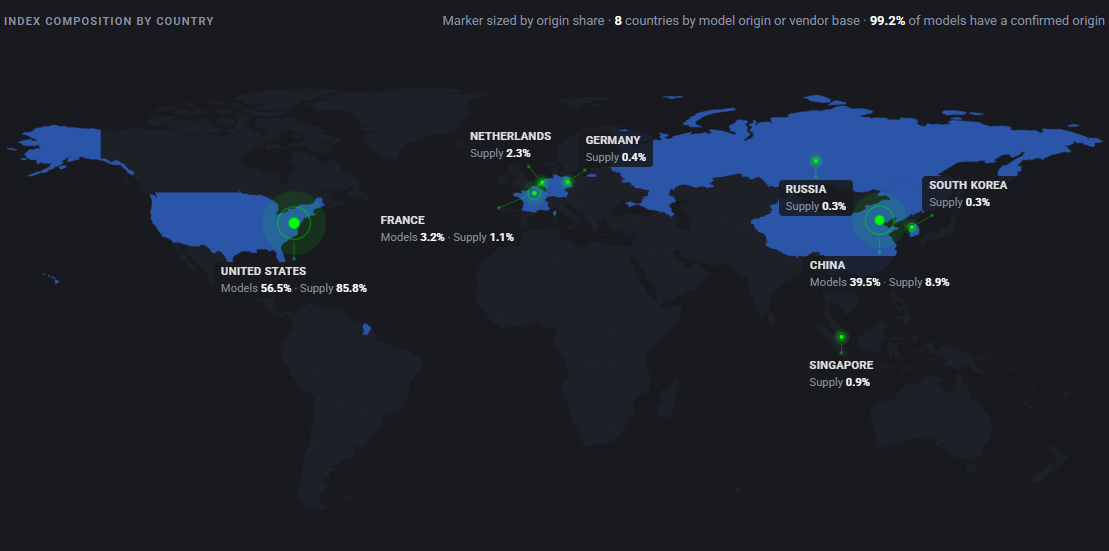
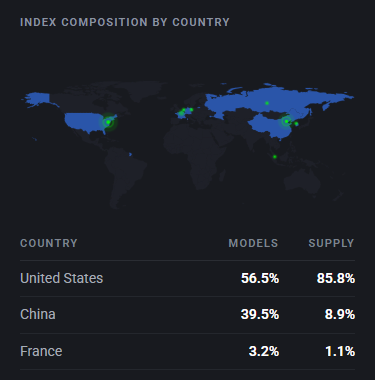
Each country shows two shares: models built there, and supply from vendors based there. In this index, 56.5% of models come from the United States, and US vendors carry 85.8% of supply.
Who sells it
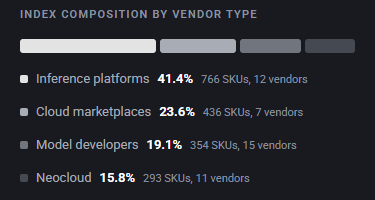
The index split by type of vendor. Here inference platforms carry 41.4% of the SKUs.

How it behaves
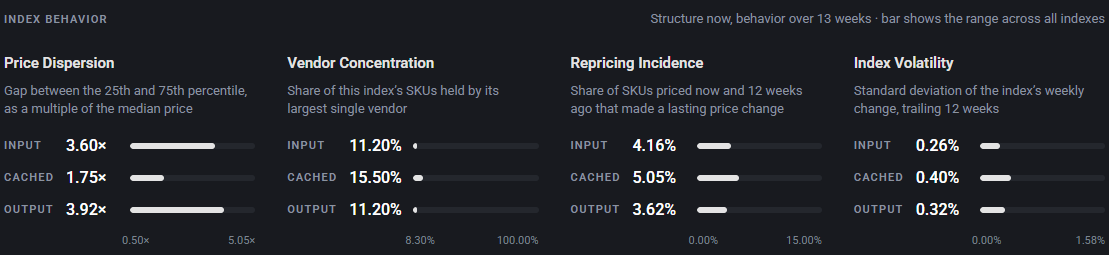
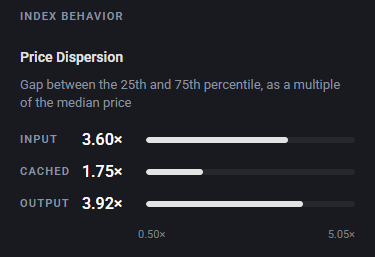
Four readings, each placed on a bar against the range across every index: how far prices spread, how much the largest vendor holds, how often prices change, and how much the level swings.
Coverage and method
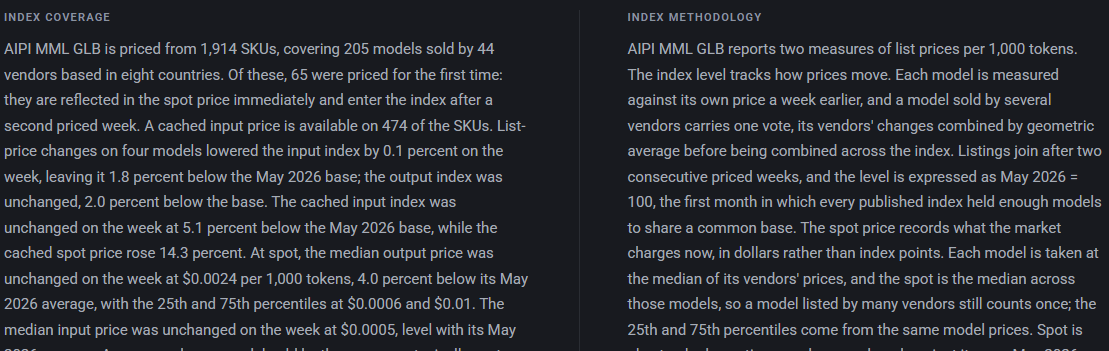
Two notes close each index: what it covers and what changed, and how it is calculated.
Market measures
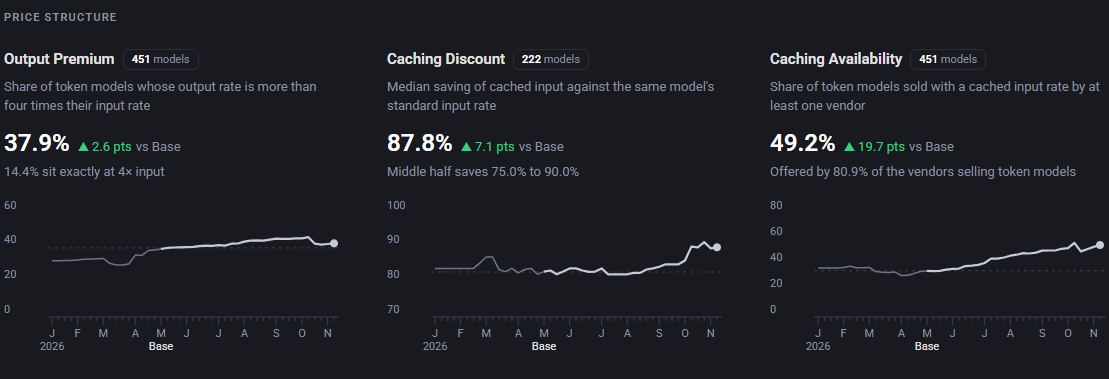
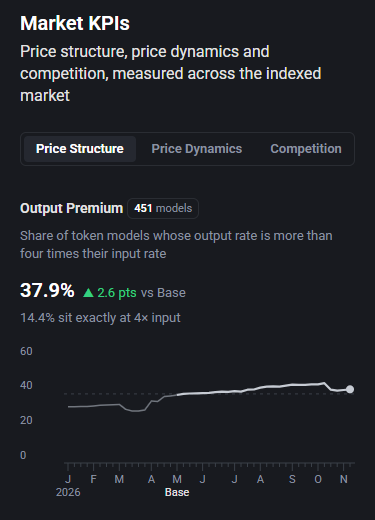
Nine measures of how the whole market prices, in three groups: price structure, price dynamics and competition. Each shows its latest value, its change and its history since January.
Let our indexes work for you.
The Clause ties your contract price to the indexes you have just learned to read.